
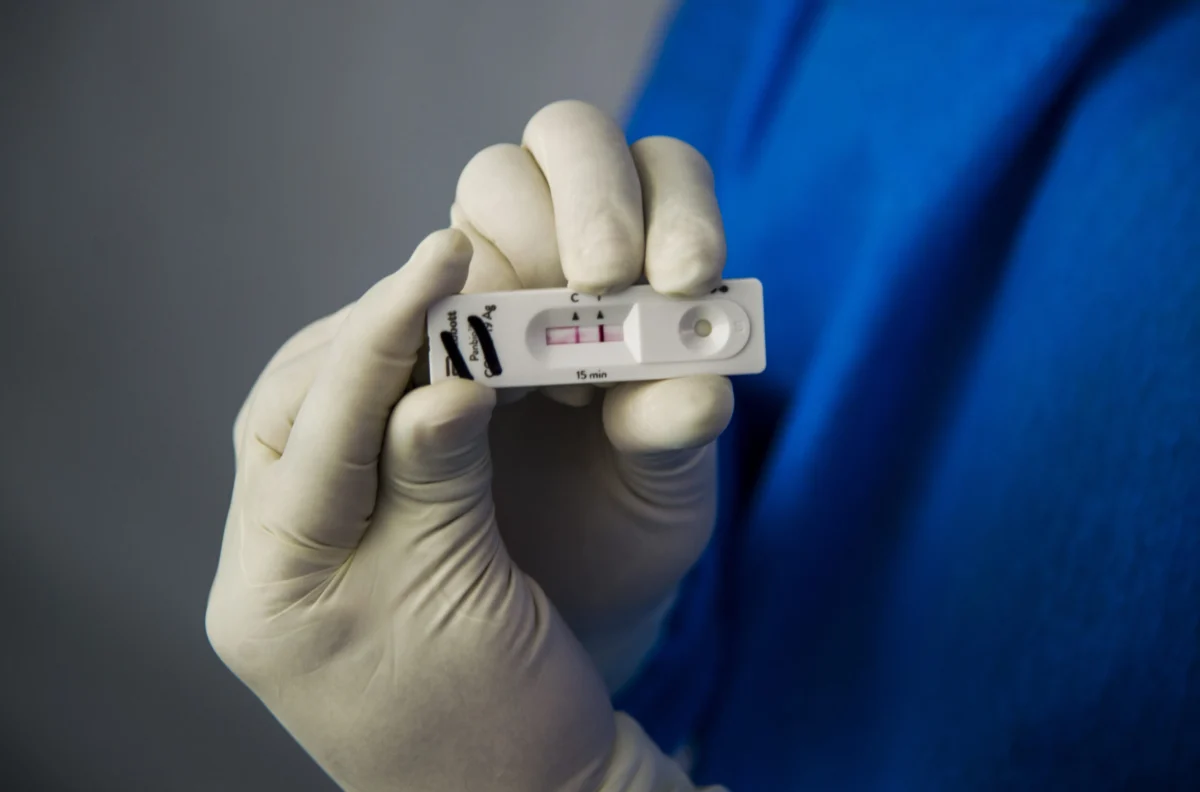
"As national COVID-19 test positivity eclipses 3% for the first time since March, a critical challenge emerges: the diminished reliability of traditional metrics, leaving public health officials and households navigating an increasingly opaque landscape of transmission."
The nation is witnessing a notable uptick in COVID-19 test positivity, crossing the 3% threshold for the week ending August 8th, a milestone not reached since March. This rise, observed across all 50 states, signals a renewed spread of the virus. While emergency department visits for COVID-19 symptoms remain relatively low nationwide, data indicates an upward trend in the Western and Southern regions as of August 12th. However, the true scale of this increase is becoming increasingly difficult to quantify due to a significant erosion in the traditional metrics used for public health surveillance. This shift presents a unique challenge as the country heads into the fall respiratory season, with schools reopening and families engaging in end-of-summer travel, all while the updated COVID-19 vaccine is not yet widely available. This less precise data environment forces households to make crucial decisions with a coarser understanding of the viral landscape than in previous years.
A Threshold Crossed Just Before School Reopens
Despite the rising positivity rates, key indicators of severe illness have remained largely stable. Hospitalizations and deaths have not seen a substantial increase, and overall acute respiratory illness activity is at the lower end of the seasonal spectrum. Influenza and Respiratory Syncytial Virus (RSV) activity are also within expected summer ranges. The significance of the current positivity rate climb is contextualized by its scale; while approaching 4% by mid-August, this figure is considerably lower than the above 9% weekly rate recorded at the same point last year. This current wave appears to have initiated later and from a lower baseline compared to recent summers.
The pattern of summer increases in COVID-19 cases has become a recurring phenomenon in the United States since 2020, and the current rise aligns with these established seasonal trends rather than representing an unexpected surge. Experts like Caitlin Rivers, an outbreak science expert at the Johns Hopkins Center for Health Security, have noted that August consistently falls within a period of elevated COVID-19 activity. This predictability, however, does not diminish the challenges posed by the current data limitations.
Officials Can See Direction but Not Size
Public health officials at the state level are candidly expressing their inability to accurately characterize the magnitude of the current COVID-19 increase. Scott Harris, Alabama’s state health officer, described the situation as an "uptick" rather than a "surge," noting that it is not significantly impacting hospitalizations or mortality data. The underlying issue, as articulated by Harris during a briefing hosted by the Association of State and Territorial Health Officials, is a fundamental breakdown in the interpretability of the data.
"We don’t know how to describe these numbers that we’re seeing," Harris stated, highlighting the loss of a reliable denominator for positivity rates. He explained that positive test results often arrive without accompanying clinical data that would provide necessary context. These remarks, as reported by CNN, underscore a critical shift in public health surveillance. During the pandemic’s peak, daily case counts were a primary metric. Now, the focus has shifted to proxies such as wastewater concentrations, emergency department visit percentages, laboratory positivity rates, and modeled transmission estimates. While each of these metrics offers valuable insights into viral trends, none directly counts the total number of infections.
The widespread adoption of at-home testing has further widened this surveillance gap. Individuals who test positive at home and isolate without seeking clinical care are no longer captured by traditional public health reporting systems. This phenomenon, coupled with a shrinking base of clinical testing (where tests are increasingly concentrated among those seeking medical attention for severe symptoms), creates a skewed picture of viral spread. As previously reported by MedicalDaily, CDC modeling indicates ongoing COVID-19 growth nationwide, even as emergency visits remain low. These models effectively describe the direction of the trend but were not designed to quantify the overall burden of disease, a distinction that has become increasingly difficult to bridge in the current data environment.
Two Wastewater Systems, Two Different Verdicts
The challenges in interpreting COVID-19 data are starkly illustrated by the divergent findings from the nation’s two primary wastewater surveillance systems. The CDC’s wastewater surveillance data, as of the week ending August 8th, classified national SARS-CoV-2 activity as "very low." In contrast, WastewaterSCAN, a monitoring program managed by Stanford University that employs a different methodology and reports on a more rapid cycle, indicated "high" activity nationwide. WastewaterSCAN observed an upward trend in SARS-CoV-2 concentrations over the preceding 21 days across most regions, with the exception of the Midwest, where activity was classified as "medium."
Amanda Bidwell, WastewaterSCAN’s scientific program manager, reported to TODAY that concentrations have risen steadily in recent weeks, noting a significant 106% increase in SARS-CoV-2 concentrations compared to July 2026. The Western and Southern regions are currently reporting the highest concentrations. Both data sets have their own methodological strengths and limitations. The CDC’s system utilizes a higher historical baseline for comparison, which can lead to a delayed reporting of emerging waves. WastewaterSCAN’s faster reporting cycle and different sampling sites provide a more immediate snapshot. Neither system is inherently "wrong," but the substantial discrepancy makes it difficult for households to make informed decisions about protective measures, such as masking on flights, based on a single national figure.
Reading Local Signals When National Ones Blur
In light of these national data complexities, the practical approach for individuals and communities is to focus on more localized data. State and county health department dashboards, local wastewater monitoring sites, and the CDC’s state-level wastewater data offer a more relevant and granular picture of viral activity than national averages that can mask regional variations. For the majority of households, maintaining general awareness of local trends is likely the most appropriate response.
However, a smaller, more vulnerable segment of the population requires a more proactive approach. Adults aged 65 and older, infants, individuals who are immunocompromised, and those with multiple chronic health conditions should take specific steps. This includes confirming their current vaccination status and developing a clear plan with their healthcare provider to access antiviral treatments promptly should symptoms arise, as these medications are most effective when administered early in the course of illness. Such personalized risk assessment and planning conversations are best conducted with a clinician.
Individuals experiencing symptoms such as a sore throat, congestion, cough, fever, or unusual fatigue this month should consider testing for COVID-19 rather than assuming it is a common cold. The overlapping nature of symptoms with other circulating viruses underscores the importance of testing to determine eligibility for antiviral treatment. The CDC recommends that symptomatic individuals stay home and can resume normal activities once they have been fever-free for 24 hours without the use of fever-reducing medication. Any severe symptoms, including difficulty breathing, chest pain, confusion, or bluish discoloration of the lips, warrant urgent medical evaluation, irrespective of a test result.
The updated COVID-19 vaccine formulation for the upcoming respiratory season is anticipated in the fall. Infectious disease specialists have expressed optimism regarding the availability of updated flu and COVID-19 vaccines, despite potential delays in federal advisory committee approvals. Discussions regarding the optimal timing for high-risk individuals to receive these vaccinations should be directed to a healthcare provider.
A key unresolved question remains whether increased transmission will eventually translate into a rise in hospitalizations. Historically, transmission and severity have not always moved in lockstep, and the current summer surge appears to be an instance where these two metrics have diverged.
Key Questions Answered
What is the new figure? National COVID-19 test positivity rose above 3 percent for the week ending Aug. 8, the first time since March, and has continued to climb.
Is this wave bigger than last year’s? No. At the same point last year, the weekly positivity rate was above 9 percent. This current wave started later and from a lower baseline.
Are hospitals filling up? No. Emergency department visits for COVID-19 remain low in most regions, and hospitalizations and deaths are not showing a substantial rise.
Why do the two wastewater systems disagree? The CDC and WastewaterSCAN use different sampling networks, methodologies, and historical baselines for comparison. The CDC classifies national activity as very low, while WastewaterSCAN reports it as high.
Which regions are seeing the clearest increases? The West and South are experiencing the most noticeable increases in both emergency department visits and wastewater concentrations.
Who should act on this now? Adults aged 65 and older, infants, immunocompromised individuals, and those with multiple chronic conditions should confirm their vaccination status and discuss an antiviral treatment plan with a clinician.
When should someone seek urgent care? Trouble breathing, chest pain, confusion, or bluish lips require immediate medical evaluation.
